Pages
▼
Friday, October 31, 2014
Quick Update Nifty Bank Nifty Axis Bank and SBIN dated 31/10/2014
Spot Nifty Update breakout at 8072 now high 8231 and still on
Spot Nifty Update breakout at 16760 now high 16861and still on
Spot Axis Bank Update breakout at 430 now high 435.75 and still on
Spot SBIN Update breakout at 2700 but still lagging....
Supposed to follow the suite of Bank Nifty and Axis Bank...
Those with conviction can Buy 2700CE .... for Nov 2014 expiry...
Manage it as per your risk policy exact levels for subscribers and course students.
Those interested in our Advisory Services can write to us
1) kbr9121965@yahoo.com
or
2) kbr9121965@gmail.com
GET BARGAIN DEALS ....
LIMITED TIME OFFER for Annual Subscribers ...... and also FIRST TIME ONES.....
Love to be on YOUR SIDE for helping YOU make MONEY in MARKETS....
Happy Trading !!!
Thursday, October 30, 2014
Bank Nifty Angle Chart Update 30/10/2014
Bank Nifty Angle Chart Updated 30/10/2014 EOD...
Yesterday given the level to watch at 16576 ...
Today's low was 16561.35...
Hit the support angle and bounced back to close at 15760.05.
Breakout and support on the angle its still going well for the index.
Tomorrow angle support at 15788.
Weekly close above this is a strong close.
Happy Trading !!!
S&P500 Update 30/10/2014
S&P 500 Angle Chart Updated 29/10/2014 EOD...
Index has to stay above 1980 for sustained recovery.
On chart we see resistance at 1982.30 and support at 1977.45 for 30/10/2014.
Yahoo Finance site show the Index at 1984.79 live .
Use the above as guidance for intraday trade for today.
Happy Trading !!!
Index has to stay above 1980 for sustained recovery.
On chart we see resistance at 1982.30 and support at 1977.45 for 30/10/2014.
Yahoo Finance site show the Index at 1984.79 live .
Use the above as guidance for intraday trade for today.
Happy Trading !!!
RCOM Update 30/10/2014
RCOM given to watch at 98 levels now hit 100.80 ...
Positional view for 3 months...
Buy 98 sl 94 targets 107-116-125
Happy Trading !!!
Positional view for 3 months...
Buy 98 sl 94 targets 107-116-125
Happy Trading !!!
QUICK UPDATE FOR ITINDEX AND INFOSYS 30/10/2014
IT Index and Infosys both crossed the resistance angles given in update on 28/10/2014
IT Index angle resistance was 10904 now 11094...
Infosys angle resistance was 3856 now 3946....
Happy Trading !!!
IT Index angle resistance was 10904 now 11094...
Infosys angle resistance was 3856 now 3946....
Happy Trading !!!
Wednesday, October 29, 2014
Quick Update for November 2014 Expiry
Watch the breakout levels for November 2014 Expiry....
Spot Nifty 8072
Spot Bank Nifty 16760
Axis Bank 430
SBIN 2700
Use suitable stop loss ...
How set stop loss ... without getting hit...
If hit ....when and where to enter....
How to set targets ... Intraday and Swing.... which are achieved consistently...
Learn this in our courses.....
Happy Trading !!!
Tuesday, October 28, 2014
S&P500 Update 28/10/2014
S&P500 chart updated 27/10/2014 EOD...
Last Update 23/10/2014 ...
"Now till 6th November 2014 watch the level of 1956.80 as your guide given in
update on 22/10/2014."
Index has managed to stay above this level.
Traders can use this level for risk management and ride the trend ahead.
Now Index needs to rise above the falling angle from where it has reversed and stay put.
Sustaining above it ... can have a decent "Christmas Rally".
Happy Trading !!!
Revision of Market Lot of Derivative Contracts on Indices
Exchange periodically reviews the contract size/value of derivative contracts on Indices based on prescribed minimum value of INR 200,000 as per SEBI master circular no. CIR/MRD/DP/17/2014 dated May 20, 2014. Exchange shall revise the lot size of derivative contracts of following index with effect from October 31, 2014:
Sr. No.
|
Underlying Index
|
Symbol
|
Present Market Lot
|
Revised market Lot
|
1
|
CNX Nifty
|
NIFTY
|
50
|
25
|
2
|
Nifty Midcap 50
|
NIFTYMCAP50
|
150
|
75
|
NOTE :All contracts in the above mentioned Indices shall have the new market with effect from October 31,2014.
Happy Trading !!!
Nifty Chart Update 28/10/2014 EOD
Nifty 1 minute Chart Updated 28/10/2014 EOD.
Index moved in 2 squares .....Down and Up...
Arrows show the squares Up and Down.
Once you have the Square in place ....
It will guide you where to get In and Out...
Resistance given at 8040 High is 8037.70 ...
Made an inside day Swing Traders know How to tackle it.....
Happy Trading !!!
Monday, October 27, 2014
Nifty Monthly Square October 2014
Nifty Monthly Square updated October 2014 ....
Data from GCI Metatrader Nifty Futures....
Nifty Futures Square chart shown above...
It shows the important PRICE level of 8382 on TIME October 2014...
For the October 2014 Future we have attained a high of 8245.10 on 09 September 2014.
Watch the important LOWS marked in the Square.
Traders can keep watch on this figure .....
Happy Trading !!!
Sunday, October 26, 2014
Crude Oil Update 26/10/2014
Crude Oil weekly square chart updated 26/10/2014...
Data from GCI Metatrader Crude Oil Future.....
Price and Time squared for Crude Oil on 2nd week of April 2011 at 112.71 as seen in chart above.
Crude has yet to cross this level till date.
Crude has strong support at the level of 76.27 in the square above.
Resistance is seen at 90.57 till end of December 2014.
Below the support of 76.27 Crude under performance may continue and above the level of 90.57 it may show out performance.
Immediate support at 79.51 below which 76.27 may look possible for it.
Immediate resistance at 83.67 above which recovery is seen till end of 2014.
Happy Trading !!!
Silver Update 26/10/2014
Silver weekly square chart updated 26/10/2014...
Silver is weaker than Gold in the weekly square.
Immediate support for Silver is 17.02 below which fall may continue.
Silver has broken important angle on first week of September 2014 at the level of 18.67 from where it was short and target of 17.02 price was achieved on last week of September 2014. The same can be seen in chart.
For sustained recovery it has to be above the level of 18.01 till third week of December 2014.
Happy Trading !!!
Gold Update 26/10/2014
GOLD weekly square chart updated 26/10/2014...
Data from GCI Metatrader Gold Futures.....
Gold faces resistance at 1257 as seen in the square.
For any positive momentum it has to stay above 1257 level and will square time on 14/11/2014 at this price.
So below this level it is weak in the square.
Happy Trading !!!
Trading Courses
Professional
Courses :
1) Master Trading Course (2 days )
2) Ultimate Trading Course ( 3 days )
These two courses are for "Serious students of the Market" who have decided to make a "Dent in Markets" and are willing to make a "Concentrated Effort" to achieve their "GOALS through Trading in Markets"........
Regular Courses :
1) Square of Nine Trading Course ( 1 day )
2) Gann Swing Trading Course ( 1 day )
These courses are for those ...... "WHO" have "LOST MONEY in Markets" and have less "TRADING CAPITAL " but have to prove their "METTLE in Markets" again.
Those interested can write to me at
OR
Happy Trading !!!
Friday, October 24, 2014
BHEL Update 24/10/2014
BHEL Angles Chart Updated 23/10/2014 EOD...
Do Angles Work is for YOU to JUDGE....
Do your own maths for the above trades in Futures.....
Needs to cross the angle resistance for further trades...
No open position at 23/10/2014 EOD....
See earlier updates on BHEL Chart to know the Method....
Happy Trading !!!
S&P500 Planetary Cycle 23/10/2014
S&P 500 Planetary Cycle Chart updated 23/10/2014
Data From GCI Metatrader S&P 500 Futures.....
Important Level to watch ...
If you see the Implications of it...... In The PAST......
Red Lines show the Main Cycle .......
Blue Lines show the Sub Cycle .....
For details please see update on 17/10/2014......
Happy Trading !!!
Thursday, October 23, 2014
Trading Courses
Professional Courses :
1) Master Trading Course (2 days )
2) Ultimate Trading Course ( 3 days )
Regular Courses :
1) Square of Nine Trading Course ( 1 day )
2) Gann Swing Trading Course ( 1 day )
OR
1) Master Trading Course (2 days )
2) Ultimate Trading Course ( 3 days )
Regular Courses :
1) Square of Nine Trading Course ( 1 day )
2) Gann Swing Trading Course ( 1 day )
Avoid Frustration in Markets and Earn Coolly....
Get a clear and concise view of the TREND for any trading instrument in any trading market.
Never depend on anybody for YOUR DECISIONS in MARKETS.
Its YOUR HARD EARNED MONEY AT STAKE ...... ALWAYS REMEMBER IT ...........
INVEST ONCE and REAP BENEFITS FOR ALL YOUR TRADING LIFE....
Those interested can write to me at
OR
Wednesday, October 22, 2014
S&P500 Update 22/10/2014
S&P500 chart updated 21/10/2014.....
Last Update on 19/10/2014......
"For Monday 20/10/2014 we have to stay above 1887 level shown in chart for a
positive bias. Up to 06/11/2014 we have resistance at 1956.80 level. Crossing
this level and staying above it will auger well for the index and mark the base
for Christmas rally. Intermediate level to watch for stiff resistance will be
1920 odd for the index."
On Monday 20/10/2014 we have held the 1887 level nothing spectacular for the index which was catching its breath for the day. We opened at 1885.62 and made high of 1905.03 with low as 1882.30 and closed at 1904.1. So above 1887 one could made profits.
On Tuesday 21/10/2014 we again were above the close of 20/10/2014 1905.03. With open equals low at 1909.38. High of the day at 1942.45 and closed near the high of the day at 1941.28. So follow up action seen on the index. Level to watch was 1920 which was crossed intraday and safe traders who missed the action at open would have been safely long above 1920 with 20 points profit for the end of the day.
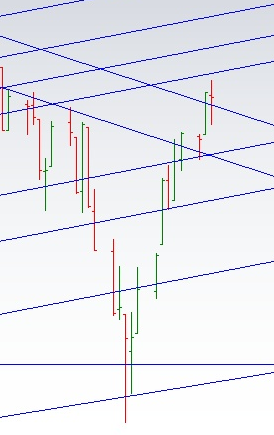
Now watch the square in chart how price is moving in it. With the close above the 50% of the square we are in recovery mode. Also we have hit another important angle with today's high. More follow -up action needed for the index. Now stop loss at 50% of the square and buying or pyramiding above the angle resistance. We are nearly 120 points above the low of 1820.66 with 75% of the lots booked at 50% of the square. Holding 25% with the stop loss.
If you know how to work out in the price time square you will survive safely with any volatility of the markets. For this one should work out the square parameters thoroughly and take positions confidently. The level of 1956.80 is price and time squaring level which is derived by the same method and will act as a guide whether we are ahead of time , on time or behind time.
Updated many times on blog October 2014 will be volatile; use your stop loss and
money management rules strictly.....
Its not over till Its over......
The Fittest will survive in this Markets and Hopers will be Losers......
Happy Trading !!!
Monday, October 20, 2014
Quick Update for October 2014 Expiry on 20/10/2014
For October 2014 Expiry ...
Key Levels :
Spot Nifty .... 7938
Spot Bank Nifty .... 16270
We have positive bias for both Indices above these levels.
Updated many time October 2014 on blog will be volatile use your stop loss and money management rules strictly.....
Its not over till Its over......
Happy Trading !!!
Key Levels :
Spot Nifty .... 7938
Spot Bank Nifty .... 16270
We have positive bias for both Indices above these levels.
Updated many time October 2014 on blog will be volatile use your stop loss and money management rules strictly.....
Its not over till Its over......
Happy Trading !!!
Sunday, October 19, 2014
S&P500 Update 19/10/2014
S&P500 chart updated for 17/10/2014...Data from GCI Metatrader....
Last Update 16/10/2014...
"For 16/10/2014 we have positive bias above 1834.16 and resistance at 1849.97. The safe level for sustained recovery will be 1867.68. Weekly close above this level may auger well for next week if sustained above it for the week."
On 16/10/2014 we had positive bias above 1834.16 and low of the day was 1835.02 and close was 1862.76. So positive day for those who had taken position.
On 17/10/2014 we crossed the level safe level of 1867.68 given in update. We opened at 1864.91 and it was the low of the day. So profitable again for the day with the weekly closing at 1886.76 .
For Monday 20/10/2014 we have to stay above 1887 level shown in chart for a positive bias. Up to 06/11/2014 we have resistance at 1956.80 level. Crossing this level and staying above it will auger well for the index and mark the base for Christmas rally. Intermediate level to watch for stiff resistance will be 1920 odd for the index.
Happy Trading !!!
Price and Time Squaring on NIFTY 19/10/2014
Above chart shows the price squaring and time where we are currently on the Nifty index.
Price is at an critical angle which has supported Nifty in past as seen above.
Currently we are in the Price Square of ....... and Time Square of ..... on the Nifty index.
This is what we learn in our Ultimate Trader Course.
As per the Price and Time Squaring following results can be derived
1) We are at an critical angle support for Nifty with last Low.
2) For 20/10/2014 the Price will square Time at 7673.53 exactly. So for Monday we have positive bias above this level.
3) For December 2015 we have Price Squaring happening at ........... i.e. the Target Price for Nifty index . Learn in our Ultimate Trader Course.
4) Learn to workout the Position of the Market in this Price and Time Squaring Technique and Be Profitable. This technique gives you a PRICE for any TIME in ADVANCE...
No TENSION in FUTURES MARKET .......
5) In our Ultimate Trader Course we teach HOW TO BE IN MARKETS ALWAYS and NEVER TO MISS ANY OPPORTUNITY.
6) We always say MY TIME is not GOOD..... Hence I FAIL.... SO ......
LET TIME BE ON YOUR SIDE ALWAYS........
JOIN OUR ULTIMATE TRADER COURSE...... !!!
Happy Trading !!!


